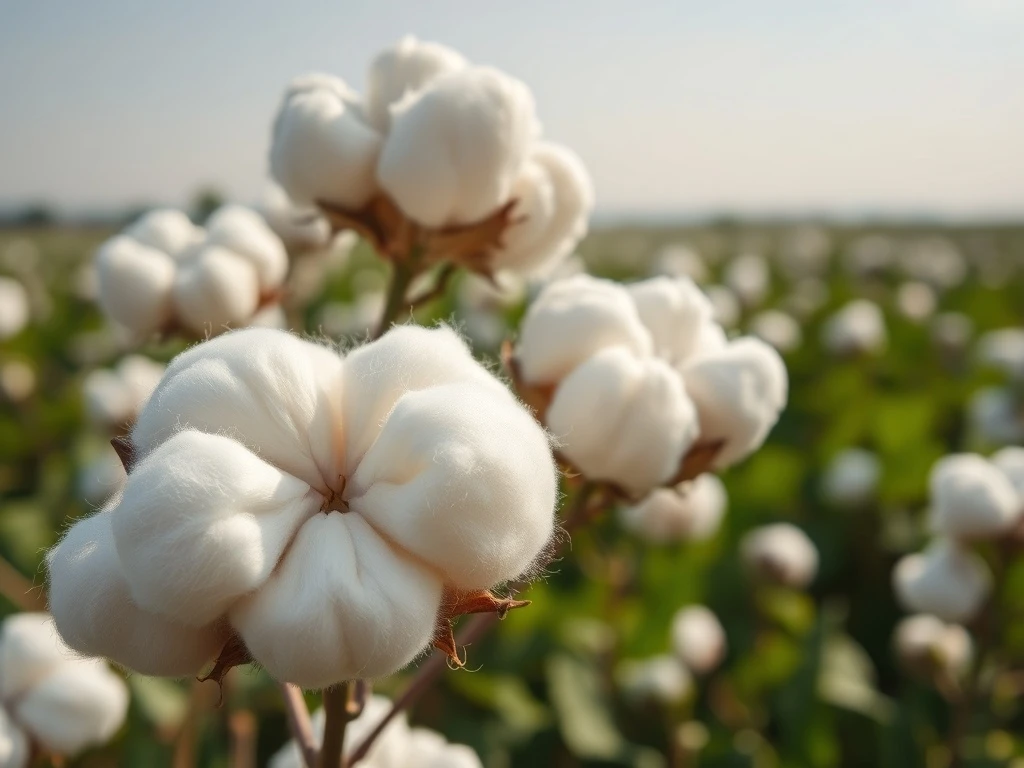
Cotton prices traded sharply lower on Wednesday, August 14, 2024, with key futures contracts falling between 74 and 93 points in midday trading. The decline, reported from Chicago-based financial data firm Barchart, coincided with the release of U.S. Consumer Price Index (CPI) data for July, which showed inflation rising 0.2% month-over-month, aligning with economist estimates. Market analysts immediately linked the bearish pressure in the soft commodity sector to a complex interplay of macroeconomic signals, including a slight dip in the U.S. dollar and falling crude oil prices. This movement highlights the sensitivity of agricultural futures to broader economic indicators, even when data meets forecasts.
Cotton Market Plunge: A Detailed Look at Wednesday’s Trading
According to data compiled by Barchart’s Alan Brugler, the most active December 2024 cotton contract (CTZ24) traded at 67.07 cents per pound, down a significant 92 points for the session. The sell-off was not isolated to the front month. Subsequently, the March 2025 contract fell 92 points to 68.65 cents, and the May 2025 contract dropped 93 points to 69.98 cents. This across-the-board weakness suggests a market reassessing near-term demand fundamentals rather than a technical anomaly. Concurrently, the U.S. Dollar Index (DXY) was down a marginal 20 points, while West Texas Intermediate (WTI) crude oil futures fell 69 cents per barrel, creating a generally risk-off tone for raw materials. The specific trigger, however, appears rooted in the morning’s inflation report, which provided traders little new bullish impetus.
Beyond the futures board, physical market indicators presented a mixed picture. The Seam, an online cotton marketplace, reported the sale of 703 bales at an average price of 65.70 cents per pound. This figure was actually 55 points higher than the previous day’s average, indicating potential support in specific cash market segments. Conversely, certified cotton stocks held in ICE-approved warehouses fell by 270 bales on August 13 through decertification, leaving a total of 15,526 bales. This reduction in visible supply typically provides price support, yet it was overwhelmed by the broader macroeconomic sentiment driving futures lower on Wednesday.
Broader Economic Context and Commodity Impact
The immediate catalyst for the sell-off was the July CPI report from the U.S. Bureau of Labor Statistics. The headline annual inflation rate came in at 2.9%, slightly below the 3.0% estimate, while core CPI, which excludes volatile food and energy prices, remained elevated at 3.2% year-over-year. For commodity traders, this data signaled a Federal Reserve likely to maintain a cautious, data-dependent stance on interest rates. Higher rates generally strengthen the dollar and increase the cost of carrying inventory, which can pressure dollar-denominated commodities like cotton. Consequently, the “in-line” report removed any hope for a dovish surprise that might have weakened the dollar and boosted commodities.
- Interest Rate Sensitivity: Cotton, as a globally traded commodity financed in U.S. dollars, faces headwinds when U.S. monetary policy remains restrictive, increasing costs for international buyers.
- Input Cost Pressure: The concurrent drop in crude oil prices lowers the cost of synthetic alternatives like polyester, potentially dampening demand for natural cotton fiber from textile manufacturers.
- Demand Uncertainty: Stable but persistent core inflation may signal continued pressure on consumer discretionary spending, impacting apparel sales and, upstream, raw cotton demand.
Expert Analysis from Agricultural Economists
Dr. John Robinson, a Professor and Extension Cotton Economist at Texas A&M AgriLife Extension, often notes that cotton markets react to a “triad of forces”: supply reports, demand signals, and macro-financial conditions. “On a day like today,” a scenario Robinson has frequently analyzed, “the macro condition is the dominant story. The CPI data didn’t shock anyone, but it confirmed the ‘higher-for-longer’ rate environment that commodities have been wrestling with all year.” This perspective is echoed in USDA reports that monitor global stock-to-use ratios. The USDA’s weekly Average World Price (AWP) for cotton, a crucial figure for the U.S. loan program, was set at 55.24 cents per pound and remains effective through Thursday. This price, significantly below futures, acts as a floor for U.S. producers and contextualizes the current futures premium.
Global Price Benchmarks and Historical Comparison
While U.S. futures fell, international price assessments told a slightly different story. The Cotlook A Index, a key benchmark for global physical cotton prices, increased by 75 points on August 13 to reach 80.45 cents per pound. This divergence between a rising physical index and falling U.S. futures can indicate regional demand strengths or logistical factors affecting immediate shipment cotton versus futures contracts for later delivery. It creates a complex arbitrage environment for merchants and highlights the importance of looking beyond a single exchange for the full market picture.
| Contract/Index | Price (cents/lb) | Daily Change |
|---|---|---|
| ICE Dec ’24 Cotton | 67.07 | -0.92 |
| ICE Mar ’25 Cotton | 68.65 | -0.92 |
| Cotlook A Index | 80.45 | +0.75 |
| USDA AWP | 55.24 | N/A |
Forward Outlook: What’s Next for Cotton Traders?
Market attention now swiftly turns to the weekly U.S. Export Sales report from the USDA, scheduled for release on Thursday morning. This report will provide tangible evidence of foreign demand, a critical counterbalance to macroeconomic fears. Additionally, traders will monitor weather patterns in key growing regions like West Texas and the U.S. Delta, as late-season crop conditions can significantly alter yield projections. The next major scheduled USDA report, the World Agricultural Supply and Demand Estimates (WASDE), will offer updated global balance sheets. Any significant revision to Chinese import forecasts or U.S. production estimates could quickly redirect the market’s trajectory.
Producer and Merchant Response to Price Volatility
Initial soundings from the Plains Cotton Cooperative Association (PCCA) suggest growers are using these price dips as opportunities to lock in futures hedges for a portion of their expected 2024 harvest. Meanwhile, merchants report that price-sensitive buyers, particularly from Vietnam and Bangladesh, have become more active on the dip, inquiring about fixed-price offers for fourth-quarter shipment. This underlying physical demand could provide a foundation for price recovery once the macro-driven speculative selling subsides. The market’s ability to hold above the psychologically important 67-cent level in the December contract will be a key technical watchpoint for the remainder of the week.
Conclusion
Wednesday’s decline in cotton prices underscores the commodity’s vulnerability to shifts in macroeconomic sentiment, even amid neutral-to-supportive physical market signals. The primary takeaway is that an “as-expected” inflation report was sufficient to trigger a broad-based sell-off, reflecting a market deeply attuned to Federal Reserve policy implications. While the drop was sharp, underlying support exists from tightening ICE stocks, a higher Cotlook A Index, and the USDA’s AWP floor. Moving forward, traders will pivot from macroeconomic data to fundamental demand metrics, with export sales and harvest progress reports likely to dictate short-term price action. The cotton market remains in a delicate balance between tangible supply-demand factors and the powerful currents of global finance.
Frequently Asked Questions
Q1: Why did cotton prices fall on Wednesday, August 14, 2024?
Cotton futures fell 74-93 points primarily due to a bearish reaction to U.S. CPI inflation data. While the report met expectations, it confirmed a persistent inflationary environment, suggesting the Federal Reserve will keep interest rates higher for longer, which pressures dollar-denominated commodities.
Q2: What is the USDA AWP and why is it important?
The USDA’s Average World Price (AWP) is a calculated price used as a reference for the U.S. cotton loan program. At 55.24 cents/lb, it acts as a fundamental price floor for U.S. growers, providing a safety net and influencing marketing decisions.
Q3: What key data should traders watch next for cotton prices?
Traders should immediately monitor the weekly USDA Export Sales report for demand signals and track weather in major U.S. growing regions. The next major scheduled event is the monthly USDA WASDE report, which provides updated global supply, demand, and ending stock estimates.
Q4: How does the price of crude oil affect cotton?
Falling crude oil prices, as seen on Wednesday, reduce the production cost of synthetic fibers like polyester. This can make polyester a more cost-competitive alternative to cotton for textile manufacturers, potentially reducing cotton demand.
Q5: What does the difference between ICE futures and the Cotlook A Index mean?
The ICE futures price (e.g., 67.07 cents) is a standardized contract for future delivery. The Cotlook A Index (80.45 cents) reflects the physical price of immediate shipment cotton in Northern Europe. A higher Cotlook A can indicate strong near-term physical demand or tightness, even if futures for later delivery are falling.
Q6: How does this price move affect a U.S. cotton farmer?
A sharp futures drop reduces the potential revenue from unpriced crop. However, farmers can use tools like futures hedging or options to lock in prices. The USDA AWP also provides a loan deficiency payment if the final market price is below the loan rate, offering a measure of income protection.