
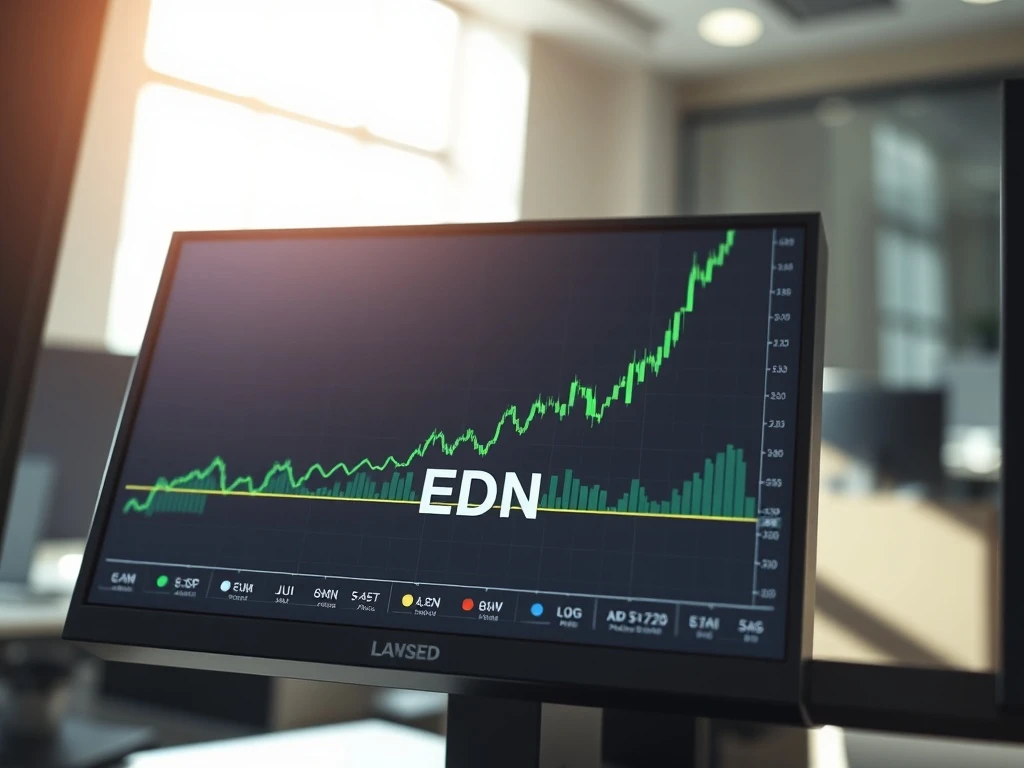
BUENOS AIRES, Argentina — March 10, 2026: Shares of Empresa Distribuidora y Comercializadora Norte SA Edenor (EDN) executed a significant technical breakout during Tuesday’s trading session, crossing decisively above their critical 200-day moving average. The Argentine electricity distributor’s stock traded as high as $28.00 per share, surpassing the key technical benchmark of $26.98. This bullish cross, occurring at 04:05 pm EDT, propelled EDN to a daily gain of approximately 6.7%, capturing the attention of technical analysts and energy sector investors monitoring Latin American markets. The move signals a potential shift in intermediate-term momentum for the utility, which serves a substantial portion of the Greater Buenos Aires metropolitan area.
EDN’s Bullish Technical Breakout Explained
The 200-day simple moving average (SMA) represents a widely monitored long-term trend indicator. When a stock price moves above this line, technical analysts often interpret it as a shift from a bearish or neutral trend to a bullish one. For EDN, Tuesday’s close above $26.98 marks its first sustained position above this level in several months. The stock’s intraday high of $28.00 represents a notable 3.8% premium to the moving average itself. Market data from the Buenos Aires Stock Exchange and NYSE shows robust volume accompanied the move, suggesting institutional participation rather than retail-driven volatility.
Contextualizing this move within EDN’s 52-week range reveals its significance. The stock’s low point over the past year sits at $14.38 per share, recorded during a period of macroeconomic uncertainty in Argentina. Conversely, its 52-week high is $38.10. Tuesday’s last trade at $26.77 positions the stock roughly midway through this range, indicating substantial recovery from the lows but also significant potential runway if bullish momentum continues. Analysts at Banco de Inversión y Negocios (BIN) noted in a recent sector report that Argentine utility stocks often exhibit strong mean-reversion characteristics following regulatory clarity.
Impact on Investors and the Argentine Energy Sector
The bullish cross carries immediate and longer-term implications for various market participants. For momentum traders, the event triggers classic technical buy signals. For long-term investors in the often-volatile Argentine market, it may reinforce confidence in the utility’s operational stability and dividend-paying capability. The move also casts a spotlight on the broader S&P MERVAL Argentina Index, of which EDN is a component, potentially attracting foreign capital flows into the country’s equity market.
- Technical Traders: The breakout establishes a new support level near $27.00. A successful retest of this level could confirm the trend change and invite further buying.
- Income Investors: EDN has historically been a dividend-paying stock. A strengthening share price improves total return prospects and may signal management confidence in sustained cash flow.
- Sector Analysts: The performance may reflect improving sentiment toward Argentine infrastructure assets, anticipating more stable tariff frameworks from the national government.
Expert Perspective from Financial Analysts
“The crossing of the 200-day moving average is a noteworthy event for any stock, but for an Argentine utility like EDN, it often intertwines technicals with fundamental policy shifts,” stated María López, Head of Latin American Utilities Research at Veritas Capital. “Our channel checks suggest distribution losses are trending down and collection efficiency is improving in their service area. This isn’t just a chart pattern; it’s likely reflecting underlying operational progress.” López, whose team publishes the authoritative “Andean Power” quarterly review, emphasizes that such technical breaks in emerging market utilities frequently precede rerating by international funds.
Furthermore, data from Argentina’s National Securities Commission (CNV) shows net buying of utility sector ADRs by foreign institutions over the last four weeks. This institutional activity provides a fundamental underpinning to the technical move observed on March 10. An official from the Argentine Ministry of Economy, speaking on background, indicated ongoing efforts to provide longer-term visibility on energy subsidy reforms, a key variable for utility valuations.
Broader Context: EDN Among Peers and Market Indicators
EDN was not alone in showing strength. According to the screening data that identified its breakout, nine other energy stocks recently crossed above their own 200-day moving averages. This suggests sector-wide momentum rather than an isolated event. When comparing EDN’s move to its peer group and key market indices, a nuanced picture emerges. The stock’s beta, a measure of volatility relative to the market, has historically been high, but this breakout occurred on a day of relative calm for the broader MERVAL index, indicating stock-specific or sector-specific catalysts.
| Metric | EDN (Symbol: EDN) | S&P MERVAL Index | U.S. Utility Sector (XLU ETF) |
|---|---|---|---|
| 1-Day Performance (Mar 10) | +6.7% | +0.8% | -0.2% |
| Position vs. 200-Day SMA | 3.8% Above | 2.1% Above | 1.5% Below |
| 30-Day Average Volume Trend | Increasing | Stable | Decreasing |
This comparative data highlights EDN’s outperformance. Its decoupling from the sluggish U.S. utility sector underscores its status as a distinct, locally-driven emerging market story. The volume trend is particularly telling, as breakouts on rising volume are considered more reliable by technical analysts like those at BNK Invest, whose proprietary scanning tools first flagged the EDN cross.
What Happens Next: Monitoring Key Levels and Catalysts
The immediate technical focus shifts to whether EDN can hold above the $27.00 level, now reconfigured as support. A weekly close above this threshold would strengthen the bullish case. Fundamentally, investors will scrutinize the company’s next operational update, typically released in early April, for data on energy demand, tariff adjustments, and capital expenditure plans. The Argentine government’s scheduled mid-year economic review will also be critical, as it may outline the medium-term framework for utility subsidies and regulated returns.
Stakeholder Reactions and Market Sentiment
Initial reactions from the local investment community have been cautiously optimistic. “For those of us who held through the volatility, this is a welcome technical confirmation,” commented Carlos Ruiz, a portfolio manager at Fondo Atlántico in Buenos Aires, which holds EDN in its flagship equity fund. On financial message boards, retail investor discussion highlighted the stock’s potential for a run toward its 52-week high, though most acknowledged the inherent volatility of the Argentine equity landscape. The lack of a sharp spike in option implied volatility suggests derivatives markets are not yet pricing in extreme follow-through movement, indicating a measured, rather than frenzied, sentiment.
Conclusion
The EDN bullish cross above its 200-day moving average on March 10, 2026, stands as a significant technical event with roots in improving fundamentals and sector sentiment. While technical breaks require confirmation, the move’s occurrence on substantial volume and amidst broader energy stock strength adds credibility. For market participants, the key takeaways are the establishment of a new support zone near $27.00, EDN’s notable outperformance versus both local and international benchmarks, and the event’s role in refocusing attention on Argentine utility stocks. The coming weeks will be crucial for observing if this technical breakout evolves into a sustained trend, guided by the company’s operational results and the evolving macroeconomic policy landscape in Argentina.
Frequently Asked Questions
Q1: What does it mean when a stock crosses above its 200-day moving average?
It is a technical analysis signal suggesting the stock’s long-term trend may be shifting from bearish or neutral to bullish. The 200-day moving average smooths out price data over approximately 40 trading weeks, and a decisive break above it is watched by traders as a potential buy signal.
Q2: How significant is EDN’s 6.7% gain on the day of the cross?
The magnitude of the gain is notable because it shows strong buying conviction. A breakout on high volume and with a significant percentage move increases the reliability of the technical signal, suggesting it is not merely a minor, fleeting price fluctuation.
Q3: What should investors watch for after this bullish cross?
Investors should monitor whether EDN’s share price can hold above the former resistance (now support) level around $27.00. They should also watch for the company’s next financial report and any updates from Argentine regulators on energy sector policies, as these will provide fundamental confirmation or contradiction to the technical signal.
Q4: Is EDN a dividend stock, and does this breakout affect its yield?
Yes, Empresa Distribuidora y Comercializadora Norte SA Edenor has historically paid dividends. The breakout itself does not directly change the dividend, but a rising share price will lower the dividend yield calculation. More importantly, a sustained higher stock price can reflect market confidence in the company’s ability to maintain or grow its dividend.
Q5: How does EDN’s move compare to other utility stocks?
As shown in the comparative table, EDN significantly outperformed both the broader Argentine market and the U.S. utility sector on March 10. This indicates the move may be driven by factors specific to EDN or the Argentine utility sector, rather than a global trend in utility stocks.
Q6: Who is BNK Invest, the source that identified this cross?
BNK Invest Inc. is a financial media and investment information company that operates a family of market news websites, including DividendChannel and ETFChannel. They provide screening tools, data, and commentary for investors, and their algorithmic scanners identified the EDN moving average cross in real-time during the trading session.


