
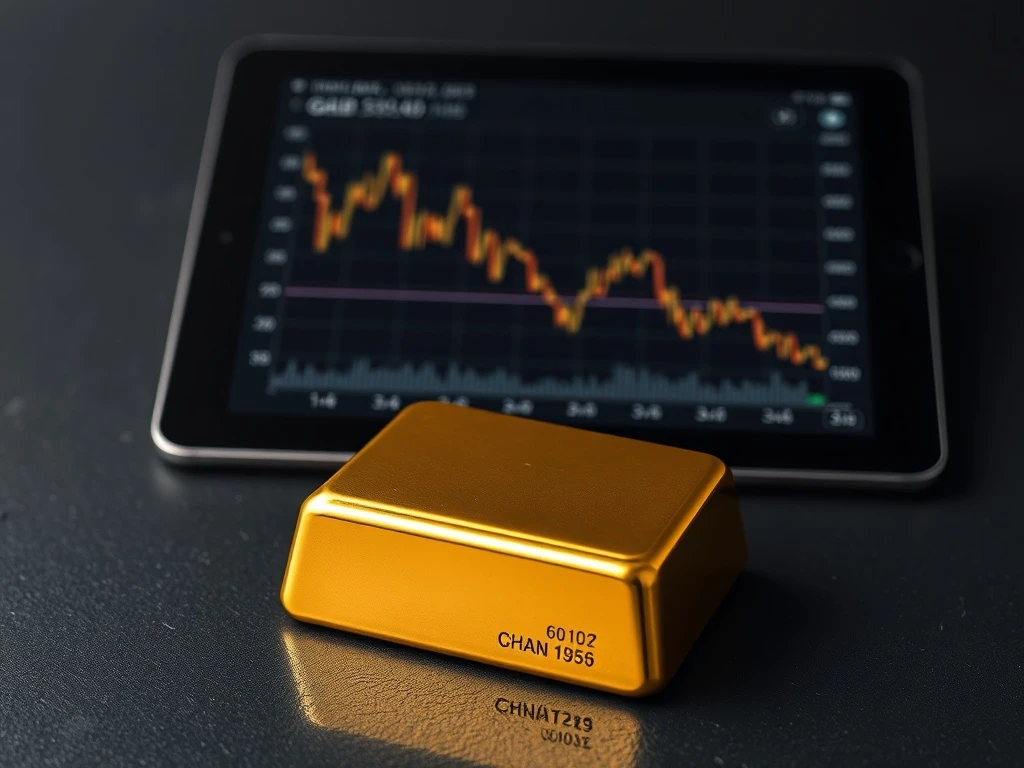
LONDON, April 10, 2026 — The spot price of gold continues to face significant downward pressure, struggling to maintain momentum below the critical $5,200 per ounce threshold. This persistent weakness stems primarily from a resurgent US Dollar and climbing US Treasury yields, which have eroded the appeal of the non-yielding precious metal. Market data from the London Bullion Market Association (LBMA) shows the metal trading in a narrow band between $5,180 and $5,195, a level it has tested repeatedly throughout the week without a decisive breakout.
Gold Price Below $5,200 Amidst Dual Macro Headwinds
The gold price below $5,200 represents a key psychological and technical barrier for traders. Analysts at Goldman Sachs Commodities Research note that the Dollar Index (DXY) has appreciated 2.3% over the past fortnight, its strongest two-week gain since January. Concurrently, the yield on the benchmark 10-year US Treasury note has climbed to 4.85%, its highest level in eight months. “These two factors are acting in concert,” explains Dr. Anya Sharma, Head of Commodity Strategy at the World Gold Council. “A stronger dollar makes gold more expensive for holders of other currencies, while higher yields increase the opportunity cost of holding a zero-yield asset like gold. The market is recalibrating expectations around the Federal Reserve’s rate path.”
This price action follows a volatile first quarter where gold briefly touched $5,250 in March on safe-haven flows, only to retreat as macroeconomic data shifted. The current consolidation phase, now entering its third week, highlights the market’s indecision. Historical charts from Bloomberg terminal data indicate that the $5,150-$5,200 zone has served as both support and resistance multiple times over the last eighteen months, making the current test particularly significant for determining the medium-term trend.
Impact on Precious Metals Market and Investor Portfolios
The sustained pressure is triggering tangible shifts across the precious metals market. Exchange-traded fund (ETF) holdings, as tracked by Bloomberg, have seen outflows of approximately 15 metric tons globally over the last month. Meanwhile, physical demand from central banks, a key support pillar in recent years, shows signs of moderation. The People’s Bank of China reported a net addition of just 8 tonnes to its reserves in March, its smallest monthly increase in over a year.
- ETF Outflows: Major funds like SPDR Gold Shares (GLD) have experienced consistent selling pressure, reflecting a shift in institutional sentiment away from defensive assets.
- Mining Sector Pressure: Share prices for major gold miners, including Newmont Corporation and Barrick Gold, have underperformed the broader equity market, with the NYSE Arca Gold BUGS Index down 7% month-to-date.
- Options Market Positioning: Data from the CME Group shows a notable increase in put option volumes at the $5,150 strike price, indicating traders are hedging against or betting on further downside.
Expert Analysis on Federal Reserve Policy and Gold
Market focus remains squarely on monetary policy. “The narrative has shifted from ‘higher for longer’ to questioning if the next move could even be a hike, not a cut,” states Michael Chen, Chief Fixed Income Strategist at BlackRock. He references recent comments from Federal Reserve Governor Christopher Waller, who emphasized the need for “several more months of good inflation data” before considering easing. This hawkish tilt has directly fueled the US Dollar strength and yield ascent. Chen’s team has revised its year-end gold forecast downward to $5,100, citing the recalibrated rate outlook. Conversely, analysts at UBS maintain a more bullish stance, arguing that geopolitical tensions and eventual Fed easing will support prices above $5,300 by year-end, creating a clear divergence in institutional views.
Broader Context: Gold’s Performance Against Other Assets
Placing the current gold price pressure in a wider context reveals its relative performance. While gold has stagnated, other traditional inflation hedges have shown mixed results. Bitcoin has rallied over 15% in the same period, while real estate investment trusts (REITs) have declined. The unique dynamic for gold is its sensitivity to real yields—the nominal yield minus inflation. Even if nominal yields rise, if inflation expectations rise faster, real yields can fall, supporting gold. Currently, breakeven inflation rates derived from Treasury Inflation-Protected Securities (TIPS) have remained stable, meaning the rise in nominal yields is translating directly into higher real yields—a perfect storm of headwinds for bullion.
| Asset | 30-Day Performance | Primary Driver |
|---|---|---|
| Gold (Spot) | -1.8% | Stronger USD, Higher Real Yields |
| S&P 500 Index | +3.2% | Strong Corporate Earnings |
| US 10-Year Treasury | Yield +45 bps | Fed Policy Reassessment |
| Bitcoin | +15.5% | Institutional ETF Flows |
What Happens Next: Key Levels and Catalysts to Watch
The immediate technical outlook hinges on whether support at $5,150 holds. A decisive break below this level could open the door to a test of the 200-day moving average, currently near $5,050. Conversely, a weekly close above $5,220 could signal the correction is over. The primary near-term catalyst will be the US Consumer Price Index (CPI) report scheduled for release next Wednesday. A hotter-than-expected print would likely reinforce the hawkish Fed narrative, applying further pressure. “The market is in a holding pattern, waiting for the next major data point,” confirms Lisa Wang, a veteran floor trader at the COMEX. “Until then, we’re range-bound. The commitment of traders report shows managed money net longs have been trimmed, but not abandoned, suggesting a cautious wait-and-see approach.”
Stakeholder Reactions: From Miners to Retail Investors
Reactions across the stakeholder spectrum vary. Major mining executives, speaking at the Denver Gold Forum this week, expressed confidence in the long-term fundamentals but acknowledged short-term volatility. “Our cost base is well below $1,500 an ounce, so we generate significant cash flow even at these levels,” noted Newmont CEO Tom Palmer. Meanwhile, retail investor sentiment, as gauged by online brokerage platforms, shows a split. Some view the dip as a buying opportunity for long-term portfolio insurance, while others are rotating into money market funds offering yields above 5%. Jewelry demand in key markets like India and China remains seasonally soft, providing little physical support to offset financial market selling.
Conclusion
The struggle for the gold price below $5,200 underscores a market caught between competing forces. The immediate headwinds of US Dollar strength and rising Treasury yields are powerful, driven by a reassessment of the Federal Reserve’s policy trajectory. However, underlying support from geopolitical uncertainty and central bank diversification strategies remains. Investors should monitor the $5,150 support level closely and watch for signals in upcoming inflation data. The next major move in gold will likely be dictated not by the metal’s own narrative, but by the broader macroeconomic story unfolding in bond and currency markets. For now, patience and attention to real yield dynamics are paramount.
Frequently Asked Questions
Q1: Why is the gold price struggling below $5,200?
The primary reasons are a stronger US Dollar, which makes gold more expensive in other currencies, and higher US Treasury yields, which increase the opportunity cost of holding non-yielding gold. These factors are driven by market expectations that the Federal Reserve may delay interest rate cuts.
Q2: What level is critical support for gold right now?
Technical analysts are closely watching the $5,150 per ounce level. A sustained break below this support could trigger further selling, potentially targeting the 200-day moving average near $5,050.
Q3: When is the next major event that could move the gold price?
The next US Consumer Price Index (CPI) inflation report, scheduled for release on April 16, 2026, is the most immediate catalyst. A higher-than-expected reading would likely pressure gold further, while a cooler reading could provide relief.
Q4: Are central banks still buying gold?
Yes, but at a moderated pace. Recent data, such as from the People’s Bank of China, shows continued additions to reserves but at the slowest monthly rate in over a year, removing a key source of consistent demand that supported prices in 2024-2025.
Q5: How does gold’s performance compare to stocks and bonds recently?
Gold has underperformed major stock indices like the S&P 500, which has risen on strong earnings, and has faced direct pressure from rising bond yields. Its negative correlation with real interest rates is the dominant relationship currently.
Q6: What does this mean for someone who owns gold ETFs or mining stocks?
Short-term volatility is likely to continue. ETF holders may see further outflows pressure prices, while mining stocks could remain under pressure due to leverage to the metal price. Long-term investors might view this as a period of consolidation within a broader uptrend, but should be prepared for further downside if key support breaks.


