
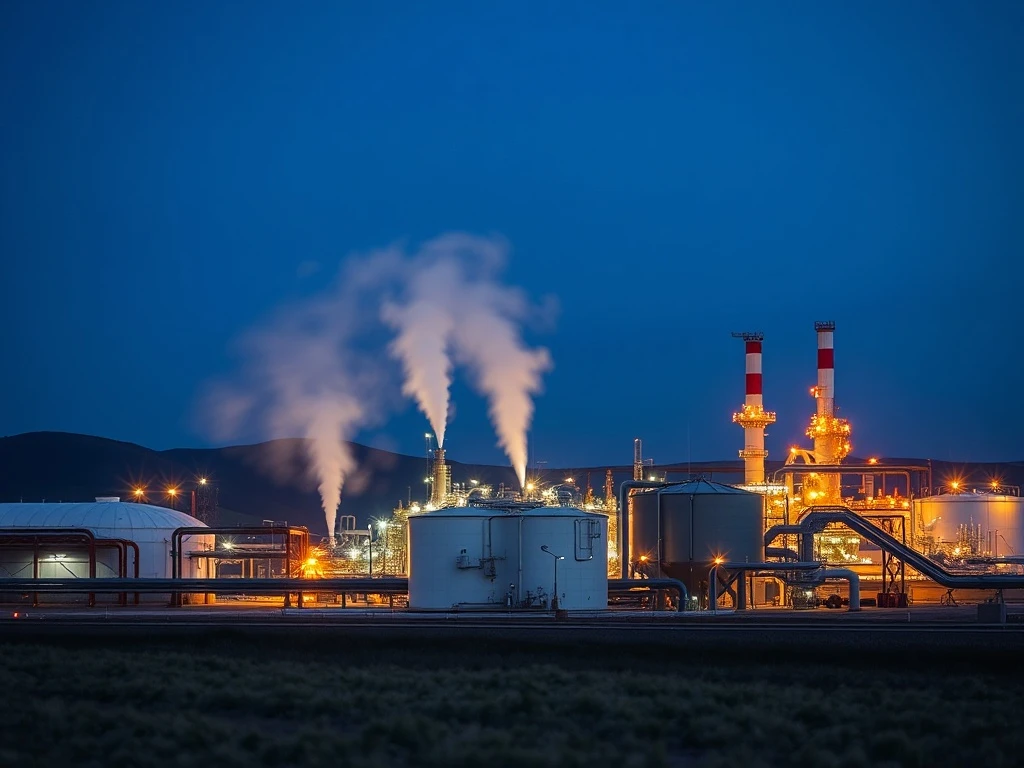
NEW YORK, March 7, 2026 — April NYMEX natural gas futures surged 6.09% Friday, closing at a one-month high as escalating conflict in Iran triggered immediate concerns about global liquefied natural gas (LNG) supply disruptions. The benchmark April contract (NGJ26) gained $0.183 to settle at $3.192 per million British thermal units (MMBtu) by 10:14 am EST, marking the sharpest single-day gain since early February. Trading volumes spiked 42% above the 30-day average as institutional investors repositioned portfolios amid growing uncertainty about Middle Eastern energy exports through the critical Strait of Hormuz. This price movement reflects mounting anxiety that geopolitical instability could constrain approximately 20% of global LNG capacity currently flowing through the region.
Geopolitical Triggers Behind the Natural Gas Price Spike
The immediate catalyst for Friday’s dramatic price action emerged Monday when Qatar Energy confirmed the temporary shutdown of its Ras Laffan LNG facility following an Iranian drone attack. According to satellite monitoring data reviewed by Barchart analysts, the world’s largest natural gas export complex suspended operations for security assessments, removing roughly 77 million metric tons annually from global markets. “The Ras Laffan closure represents the most significant supply disruption since the 2022 Nord Stream incidents,” noted Dr. Elena Rodriguez, Director of Geopolitical Risk Analysis at the Center for Strategic Energy Studies. “Unlike pipeline gas, LNG markets respond within hours to such events because cargoes can be rerouted to premium markets.”
European natural gas benchmarks responded first, with the Dutch TTF front-month contract hitting a three-year high Tuesday before pulling back slightly. However, the sustained rally in U.S. futures indicates traders anticipate increased demand for American LNG exports to fill the supply gap. The U.S. Energy Information Administration (EIA) reported Thursday that LNG feedgas deliveries to export terminals averaged 19.5 billion cubic feet per day (bcf/d) this week, remaining near capacity despite the global turmoil. This resilience stems from the United States having no direct production or export infrastructure in the immediate conflict zone, positioning American suppliers as potential beneficiaries of regional instability.
Immediate Market Impacts and Contradictory Signals
Friday’s trading session revealed competing fundamental forces creating unusual volatility in natural gas markets. While geopolitical risks pushed prices upward, domestic weather forecasts and production data provided countervailing pressure. The Commodity Weather Group’s midday update predicted well-above-average temperatures across the eastern two-thirds of the United States through March 10, potentially reducing residential heating demand during what traders call the “shoulder season” between winter and summer peaks.
- Supply Expansion: BloombergNEF data showed U.S. dry gas production reached 113.6 bcf/d Friday, representing a 6.4% year-over-year increase. Active natural gas rigs hit a 2.5-year high of 134 last week before dipping slightly to 132 in Baker Hughes’s latest count.
- Demand Contraction: Lower-48 state gas demand registered just 77.6 bcf/d Friday, down 17.4% from the same period last year according to BNEF tracking. This decline reflects both warmer temperatures and industrial consumption patterns shifting toward renewable alternatives.
- Storage Dynamics: The EIA’s Thursday storage report revealed a larger-than-expected draw of 132 billion cubic feet (bcf) for the week ending February 27, exceeding both market consensus (124 bcf) and the five-year average (96 bcf). Total inventories now stand 2.2% below seasonal norms but remain 7.2% higher than last year’s levels.
Institutional Analysis and Expert Perspectives
Energy analysts at Goldman Sachs Commodities Research circulated a client note Friday morning highlighting the asymmetric risk profile developing in natural gas markets. “The closure of Ras Laffan creates a supply shock of approximately 2.5 bcf/d in equivalent global LNG terms,” the report stated. “However, the duration of this disruption matters more than the initial event. If the Strait of Hormuz faces prolonged security challenges, even U.S. exporters will encounter higher shipping insurance costs and potential rerouting delays.” The firm maintained its 2026 price target range of $3.00-$3.50/MMBtu but acknowledged upside risk if Middle Eastern tensions persist beyond two weeks.
Meanwhile, the Edison Electric Institute provided countervailing data showing U.S. electricity generation surged 7.84% year-over-year to 82,888 gigawatt-hours in the week ending February 28. This increased power demand, largely met by natural gas-fired generation in many regions, supports prices despite bearish weather forecasts. “We’re seeing the early stages of industrial electrification driving base load growth,” explained Michael Chen, Senior Energy Economist at the Federal Reserve Bank of Dallas. “While residential heating demand may soften with warmer springs, industrial and commercial consumption patterns are becoming less seasonal.”
Historical Context and Comparative Market Reactions
Friday’s 6% single-day gain represents the most significant price movement since Hurricane Michael disrupted Gulf Coast production in October 2024. However, the current situation differs fundamentally from weather-driven volatility. Geopolitical supply disruptions typically produce more sustained price effects because resolution timelines remain uncertain and infrastructure vulnerabilities persist even after immediate threats subside. The table below compares recent major natural price catalysts and their market impacts:
| Event | Date | Price Change | Duration |
|---|---|---|---|
| Qatar Ras Laffan Closure | March 2026 | +6.09% (1 day) | Ongoing |
| Hurricane Michael Production Disruption | October 2024 | +8.2% (peak) | 11 days |
| Nord Stream Pipeline Sabotage | September 2022 | +12.7% (1 week) | Permanent |
| Texas Winter Storm Uri | February 2021 | +35% (peak) | 7 days |
European storage levels provide additional context for global supply concerns. Gas Infrastructure Europe reported Friday that storage facilities across the continent were just 30% full as of March 4, significantly below the 44% five-year seasonal average for this date. This deficit developed despite a relatively mild winter because European utilities deliberately maintained lower inventories amid high prices and increased renewable generation capacity. Consequently, Europe’s reduced buffer makes global LNG markets more sensitive to any supply disruption, amplifying price reactions that originate overseas.
Forward-Looking Analysis: What Comes Next for Natural Gas Markets
Market participants now focus on three critical developments that will determine price direction through March. First, security assessments at Ras Laffan will indicate whether the facility can resume operations safely or requires extended maintenance. Second, diplomatic efforts to secure the Strait of Hormuz shipping lanes will influence insurance premiums and shipping availability for Qatari LNG cargoes. Third, the EIA’s next Short-Term Energy Outlook, scheduled for March 11, may revise its 2026 U.S. production forecast upward from the current 109.97 bcf/d estimate.
Industry and Regulatory Responses
The American Petroleum Institute issued a statement Friday afternoon emphasizing U.S. energy security advantages. “Today’s market movements demonstrate why American natural gas production remains essential for global stability,” said API President Amanda Johnson. “While we monitor developments abroad, our industry continues delivering reliable energy to domestic consumers and international partners.” Meanwhile, Federal Energy Regulatory Commission Chairwoman Maria Rodriguez confirmed the agency would expedite review of pending LNG export terminal applications, though she noted most projects already approved have construction timelines extending beyond 2028.
Trading desks reported increased options activity Friday, particularly in out-of-the-money call options for summer delivery contracts. “The volatility skew has shifted dramatically,” noted David Park, Head of Natural Gas Trading at Citigroup. “Traders are paying premium for upside protection through July, suggesting expectations for sustained tightness even after winter ends.” This options market activity often precedes directional moves in the underlying futures, as sophisticated investors position for extended trends rather than temporary spikes.
Conclusion
Natural gas prices reached a one-month high Friday as geopolitical risks overshadowed bearish domestic fundamentals. The 6.09% surge in April NYMEX futures reflects immediate concerns about global LNG supply disruptions following the temporary closure of Qatar’s Ras Laffan facility. While U.S. production remains robust and warmer weather may reduce heating demand, the potential for prolonged Middle Eastern instability creates asymmetric upside risk for prices. Market participants should monitor Strait of Hormuz security developments, European storage refill rates, and weekly EIA inventory reports for signals about whether Friday’s move represents a temporary spike or the beginning of a sustained rally. The coming week will prove crucial as traders assess whether supply risks justify current price levels or if domestic fundamentals reassert their influence on this volatile commodity market.
Frequently Asked Questions
Q1: Why did natural gas prices surge 6% on March 7, 2026?
Natural gas prices rallied sharply due to supply concerns after Qatar temporarily shut its Ras Laffan LNG facility following an Iranian drone attack. This facility accounts for approximately 20% of global LNG supply, creating immediate fears of prolonged disruption if Middle Eastern tensions escalate further.
Q2: How does the Iran conflict affect U.S. natural gas prices?
While the United States has no direct production in the conflict zone, global LNG markets are interconnected. Disruptions in Middle Eastern exports increase demand for U.S. LNG cargoes, particularly from European and Asian buyers seeking alternative supplies. Higher shipping costs and insurance premiums also contribute to price increases.
Q3: What happens next with Qatar’s Ras Laffan facility?
Qatar Energy is conducting security assessments to determine when operations can safely resume. The timeline depends on regional stability and whether the Strait of Hormuz remains secure for LNG tanker traffic. Previous temporary shutdowns at major facilities have lasted between 48 hours and three weeks.
Q4: Could warmer U.S. weather push natural gas prices back down?
Yes, above-average temperatures through mid-March may reduce residential heating demand during the shoulder season. However, geopolitical risks currently dominate market sentiment, meaning weather would need to be significantly warmer than forecast to offset supply concerns.
Q5: How do European storage levels affect global natural gas prices?
European storage facilities are only 30% full as of March 4, well below the 44% five-year average. This deficit makes Europe more dependent on spot LNG purchases, increasing competition for available cargoes and amplifying price reactions to any supply disruption anywhere in the global market.
Q6: What should residential consumers expect for natural gas bills?
Most residential customers have fixed-price contracts or winter hedging programs that insulate them from short-term price spikes. However, if elevated prices persist through March, some variable-rate customers may see higher bills during the final weeks of the heating season, particularly in the Northeast where heating demand remains significant.


