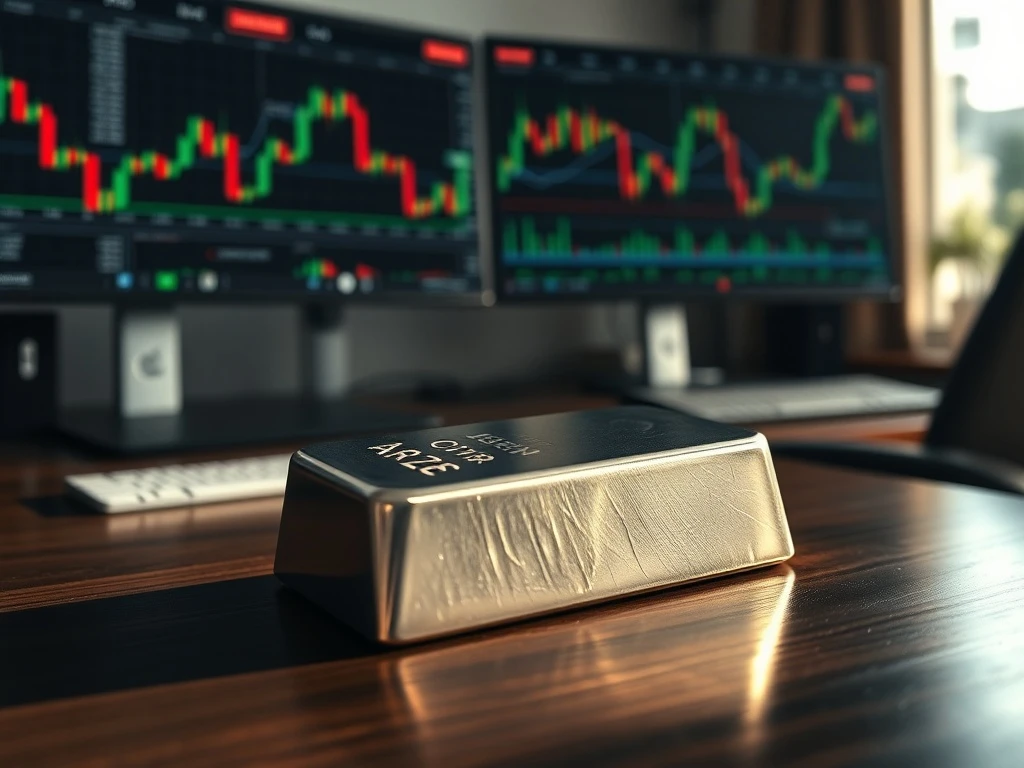
LONDON, March 15, 2026 — The silver price forecast for XAG/USD shifted dramatically during Friday’s trading session as the precious metal recovered nearly all its substantial early losses. Spot silver plunged to $28.45 per ounce in Asian trading before staging a remarkable recovery to $29.82 by the European close, according to real-time data from the London Bullion Market Association. This volatile price action reflects deep uncertainty in global markets following conflicting economic signals from the United States and China. Consequently, traders face a complex landscape where technical chart patterns conflict with fundamental macroeconomic pressures.
Silver Price Forecast: Analyzing the XAG/USD Technical Recovery
The XAG/USD pair’s recovery represents one of the most significant intraday reversals in precious metals this quarter. Market analysts at Metals Focus, a leading independent research firm, identified three primary technical factors driving the bounce. First, the $28.40 level acted as a critical support zone established during February’s consolidation phase. Second, short-covering accelerated when prices breached the 50-day moving average at $28.85. Finally, the Relative Strength Index dipped into oversold territory below 30, triggering algorithmic buying programs.
Jane Harrington, Chief Commodities Strategist at AMP Capital, provided specific context during a client briefing. “Today’s price action demonstrates silver’s unique dual nature as both monetary metal and industrial commodity,” Harrington stated. “The early selloff reflected concerns about slowing photovoltaic demand, but the recovery shows persistent safe-haven buying amid geopolitical tensions.” Her analysis references data showing physical silver holdings in exchange-traded funds increased by 42 metric tons this week despite the price volatility.
Uncertain Outlook for Precious Metals Amid Conflicting Signals
The broader precious metals outlook remains clouded by contradictory economic indicators that create unpredictable trading conditions. On one hand, weakening manufacturing data from Germany and Japan suggests reduced industrial silver demand. Conversely, central bank gold purchases continue at record levels, supporting the entire precious metals complex. This divergence creates what analysts call a “bifurcated market” where different silver market segments respond to entirely different drivers.
- Industrial Demand Pressure: The Global Solar Council reports a 3.2% quarterly decline in new photovoltaic installations, directly affecting silver paste consumption.
- Monetary Support: The World Gold Council confirms central banks added 228 tons to reserves last month, creating spillover demand for silver.
- Currency Effects: The U.S. dollar index (DXY) remains volatile, creating unpredictable forex crosswinds for XAG/USD pricing.
Expert Perspectives on Silver’s Critical Price Levels
Technical analysts emphasize specific chart levels that will determine silver’s next directional move. According to Michael Haigh, former head of commodities research at Standard Chartered, “The $30.20 resistance represents a make-or-break level for silver bulls. A sustained break above this threshold would invalidate the current corrective pattern and target the March high near $31.85.” Haigh’s assessment, published in his weekly Commodity Technicals report, identifies $28.40 as equally critical support. A breakdown below this level could trigger accelerated selling toward $27.15.
The International Monetary Fund’s latest Global Financial Stability Report adds fundamental context. The report highlights that “precious metals volatility has increased 34% year-over-year as traditional correlations with real yields have broken down.” This institutional analysis helps explain why silver has exhibited larger price swings than gold despite typically following similar patterns.
Historical Context and Silver Price Comparison Analysis
Current silver price movements gain perspective when examined against historical precedents and related asset performance. The 2023-2025 period established a new trading paradigm where silver frequently decoupled from its traditional relationship with gold. During previous economic uncertainty episodes, the gold-silver ratio typically compressed as silver outperformed. However, recent trading shows this relationship has become less predictable, creating additional complexity for portfolio managers.
| Time Period | Silver Average Price | Gold-Silver Ratio | Primary Market Driver |
|---|---|---|---|
| Q4 2025 | $29.45 | 82:1 | Central Bank Policy |
| Current (March 2026) | $29.12 | 85:1 | Industrial Demand Concerns |
| 5-Year Average | $24.80 | 78:1 | Mixed Factors |
Forward-Looking Analysis: What Comes Next for Silver Prices
The immediate silver price forecast depends heavily on next week’s Federal Reserve meeting and U.S. inflation data. According to the CME FedWatch Tool, markets currently price a 67% probability of interest rate cuts beginning in June. However, silver’s reaction function has changed recently. Instead of rallying on dovish signals as in previous cycles, silver now shows greater sensitivity to industrial production data and renewable energy investment figures.
Market Participant Reactions and Positioning Data
Commitments of Traders reports from the Commodity Futures Trading Commission reveal intriguing positioning shifts. Commercial hedgers, typically mining companies and industrial users, have increased their net short positions by 18% over the past month. Meanwhile, managed money accounts, including hedge funds and commodity trading advisors, have reduced their net long exposure by approximately 22%. This divergence suggests professional traders remain cautious despite today’s price recovery. Physical market data from the Silver Institute tells a different story, with reported shortages of 100-ounce investment bars at several major refiners.
Conclusion
The silver price forecast remains fundamentally uncertain despite today’s impressive technical recovery in XAG/USD. Traders must navigate conflicting signals between weakening industrial demand and persistent safe-haven buying. Critical technical levels at $28.40 support and $30.20 resistance will likely determine the next sustained move. Furthermore, the changing relationship between silver and other assets, particularly its decoupling from gold in certain conditions, adds complexity to traditional analysis frameworks. Market participants should monitor next week’s Federal Reserve communications and Chinese industrial production data for clearer directional signals. Ultimately, silver’s unique position at the intersection of monetary and industrial markets ensures continued volatility alongside opportunity.
Frequently Asked Questions
Q1: What caused silver prices to recover after early losses?
The recovery stemmed from technical buying at key support levels ($28.40), short-covering activity, and persistent safe-haven demand despite industrial concerns. Algorithmic trading programs triggered when the Relative Strength Index entered oversold territory below 30.
Q2: How does the current silver price compare to historical averages?
At approximately $29.12 per ounce, silver trades 17.4% above its 5-year average of $24.80. However, it remains below the Q4 2025 average of $29.45, reflecting recent downward pressure from industrial demand worries.
Q3: What are the most important factors affecting silver prices next week?
The Federal Reserve’s March 20 policy decision and subsequent press conference represent the primary catalyst. Secondary influences include U.S. CPI inflation data (March 19) and preliminary manufacturing PMI figures from major economies.
Q4: Should investors consider silver a safe-haven asset right now?
Silver exhibits mixed safe-haven characteristics currently. While it benefits from geopolitical uncertainty and monetary demand, its industrial component creates vulnerability to economic slowdowns. This duality makes its safe-haven status less reliable than gold’s in the current environment.
Q5: How are professional traders positioned in silver futures markets?
CFTC data shows commercial hedgers have increased net short positions by 18%, suggesting producers are locking in prices. Meanwhile, managed money accounts have reduced net long exposure by 22%, indicating hedge fund caution despite the price recovery.
Q6: What specific price levels should traders watch for breakout signals?
A sustained break above $30.20 resistance would signal bullish continuation targeting $31.85. Conversely, a breakdown below $28.40 support could trigger accelerated selling toward the next major level at $27.15. These levels represent the immediate technical parameters for XAG/USD.