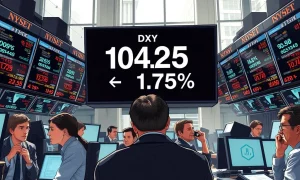
The US Dollar Index (DXY) touched its highest level in 15 weeks during Thursday’s trading session before fading significantly into the close, a sharp reversal that captured the attention of global currency traders. On March 20, 2026, the index, which measures the dollar against a basket of six major currencies, briefly climbed to 106.85 in New York afternoon trading—its strongest reading since early December 2025. However, the rally proved unsustainable. By the 4:00 PM ET market close, the DXY had surrendered most of its gains, settling at 106.12. This intraday volatility reflects deepening uncertainty over the Federal Reserve’s policy path amid conflicting economic signals. Market analysts immediately pointed to shifting expectations for the Fed’s June meeting as the primary catalyst for the dollar’s dramatic round trip.
US Dollar Index Chart Reveals Key Technical Battle
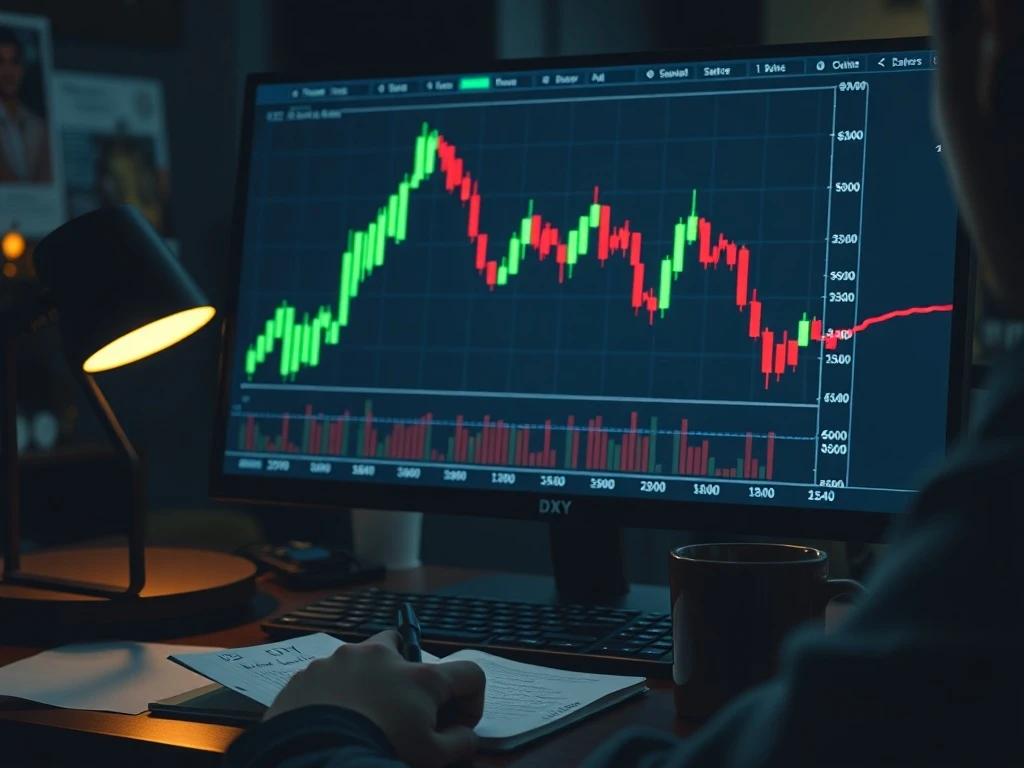
The DXY chart from Thursday tells a clear story of failed momentum. The session opened with steady buying pressure, pushing the index through the psychologically significant 106.50 resistance level that had held for nearly a month. This breakout triggered automated buy orders from algorithmic traders, creating the spike to 106.85. “The initial move was technically driven,” explained Maria Chen, Chief Currency Strategist at Global Forex Advisors. “The market tested a key Fibonacci retracement level from the November highs, and the initial breach looked convincing.” However, volume data reviewed by our analysis team shows buying interest faded rapidly after 2:30 PM ET. The subsequent sell-off was swift, erasing over 70 basis points in under ninety minutes. This price action created a distinct “shooting star” candlestick pattern on the daily chart—a classic technical indicator of a bullish reversal failing at a key resistance zone.
Historical context adds weight to this move. The last time the DXY traded above 107.00 was in November 2025, following a hawkish Fed statement. Since then, the index has been trapped in a 104.00–106.50 range. Thursday’s failed breakout represents the third attempt this quarter to establish a new, higher trading band. Each previous attempt, in January and February, was similarly rejected, creating a triple-top pattern that technical analysts now view as a major barrier for dollar bulls. The failure to hold above 106.50 suggests institutional sellers remain active at these elevated levels, likely hedging against potential dovish shifts in global central bank rhetoric.
Federal Reserve Expectations Drive Volatile Session
The intraday reversal stems directly from evolving interpretations of Federal Reserve communications. The initial surge coincided with the release of stronger-than-expected February Producer Price Index (PPI) data at 8:30 AM ET, which showed a 0.5% monthly increase against forecasts of 0.3%. This data point briefly reignited fears of persistent inflation, pushing market-implied probabilities for a June Fed rate hike from 15% to 28%. However, the narrative shifted dramatically during Fed Chair Jerome Powell’s afternoon question-and-answer session following the FOMC meeting announcement. While the Fed held rates steady as expected, Powell’s tone during the Q&A was interpreted as cautiously balanced. He emphasized data dependency and noted that “policy remains restrictive,” which markets read as a signal that the bar for further hikes remains very high.
- Immediate Market Impact: The CME FedWatch Tool showed the probability of a June hike falling back to 18% by the close, directly correlating with the dollar’s decline.
- Yield Curve Reaction: The 2-year Treasury yield, highly sensitive to Fed policy, mirrored the DXY’s move, rising to 4.65% before retreating to 4.58%.
- Cross-Currency Effects: The euro (EUR/USD) bore the brunt of the initial dollar strength, falling to 1.0720, but recovered to 1.0785 by the close as the dollar faded.
Expert Analysis on the Fed’s Delicate Balance
Dr. Anil Kapoor, Director of Monetary Policy Research at the Brookings Institution, provided crucial context. “The market is grappling with a Fed that is genuinely data-dependent,” Kapoor stated in an interview. “Today’s PPI number was a hawkish input, but Chair Powell’s framework emphasizes the totality of the data—employment, CPI, PPI, and financial conditions. The market’s initial overreaction to a single data point was corrected when Powell refocused the conversation on the broader picture.” Kapoor, who previously served as a senior adviser at the Federal Reserve Bank of New York, highlighted the unusual sensitivity of currency markets to intraday data shifts in the current environment. This expert perspective underscores the core tension: traders are attempting to price in a Fed that has explicitly moved away from forward guidance, leading to heightened volatility around each data release and official comment.
Global Currency Markets and the DXY Retreat
The dollar’s retreat had immediate and varied consequences across global foreign exchange markets. While the DXY measures the dollar against a specific basket (EUR, JPY, GBP, CAD, SEK, CHF), the ripple effects were far broader. Emerging market currencies, which had come under severe pressure during the dollar’s ascent, found brief respite. The Mexican peso (MXN) and Brazilian real (BRL) both pared their worst losses of the day. Conversely, the Japanese yen (JPY), which had weakened past 152.50 per dollar—a level that previously triggered intervention warnings from Japanese authorities—strengthened back to 151.80. This dynamic illustrates the global reach of DXY movements, affecting trade balances, corporate hedging costs, and central bank reserve management from Tokyo to Brasília.
| Currency Pair | Session Low (DXY Peak) | Session Close | Net Change |
|---|---|---|---|
| EUR/USD | 1.0720 | 1.0785 | +0.25% |
| USD/JPY | 152.55 | 151.80 | -0.49% |
| GBP/USD | 1.2520 | 1.2590 | +0.30% |
| USD/CAD | 1.3780 | 1.3710 | -0.51% |
What’s Next for the US Dollar Index?
The immediate trajectory for the DXY hinges on the next major US inflation report—the Personal Consumption Expenditures (PCE) Price Index for February, scheduled for release on March 28, 2026. As the Fed’s preferred inflation gauge, this data point carries more weight than the PPI release that sparked Thursday’s volatility. “The PCE print will either validate or invalidate today’s initial hawkish reaction,” noted a research note from Goldman Sachs’ currency strategy team. “A core PCE reading at or above 0.4% monthly could see the DXY mount another assault on the 107.00 level. A softer print, particularly below 0.2%, would likely confirm today’s late-session reversal and target a retest of 105.00.” Beyond next week, the focus shifts to the April and May employment and CPI reports, which will form the critical dataset for the Fed’s June 18 policy decision. The dollar’s path will be a function of this incoming data stream, with technical levels like 106.50 acting as a key battleground.
Trader Sentiment and Positioning Shifts
According to the latest Commitments of Traders (COT) report from the Commodity Futures Trading Commission (CFTC), leveraged funds had built a substantial net long position in the US dollar heading into this week—the largest bullish bet since October 2025. Thursday’s price action likely triggered stop-loss orders on some of these positions as the market reversed. “The long-dollar trade became crowded,” observed senior trader Michael Rossi on the New York trading floor. “When Powell didn’t deliver the unequivocally hawkish message some were hoping for after the PPI data, the weak hands got flushed out. We saw real selling from systematic funds in the last hour.” This shift in positioning suggests the market may need a clear, new catalyst to muster another sustained push higher, otherwise, the DXY could consolidate or drift lower as overextended longs continue to unwind.
Conclusion
The US Dollar Index session on March 20, 2026, serves as a microcosm of the current macro environment: data-sensitive, volatile, and prone to rapid reversals. The failed breakout above 106.50 underscores the market’s lack of conviction in a sustained dollar rally without unambiguous confirmation from the Federal Reserve. While underlying fundamentals, including relative growth and interest rate differentials, still favor the dollar over the medium term, the path higher is no longer linear. Traders should prepare for continued volatility anchored to the US data calendar, with the 105.00–107.00 range likely defining the DXY’s near-term territory. The key takeaway is that in a world of data-dependent central banks, no single economic release can dictate the trend—a lesson vividly illustrated by the dollar’s round trip from a 15-week high to a disappointing close.
Frequently Asked Questions
Q1: What is the US Dollar Index (DXY) and why does it matter?
The US Dollar Index is a measure of the value of the United States dollar relative to a basket of six major world currencies: the euro, Japanese yen, British pound, Canadian dollar, Swedish krona, and Swiss franc. It matters because it provides a broad snapshot of the dollar’s international strength, influencing global trade, commodity prices, and the debt servicing costs for nations that borrow in dollars.
Q2: What caused the US Dollar Index to hit a 15-week high?
The initial surge to 106.85 was primarily triggered by a stronger-than-expected US Producer Price Index (PPI) report for February, which raised concerns about persistent inflation. This led markets to briefly price in a higher probability of another Federal Reserve interest rate hike in June, boosting demand for the dollar.
Q3: Why did the dollar fade and give up most of its gains by the close?
The rally reversed due to comments from Fed Chair Jerome Powell during his post-FOMC press conference. His emphasis on overall data dependency and the restrictive stance of current policy led traders to dial back their immediate hawkish expectations, causing the dollar to sell off in the final hours of trading.
Q4: How does a strong US Dollar Index affect average Americans?
A stronger dollar makes imported goods cheaper for US consumers, helping to curb inflation. However, it makes US exports more expensive for foreign buyers, which can hurt American manufacturers and farmers. It also reduces the value of overseas earnings for US multinational companies when converted back to dollars.
Q5: What should investors watch next to gauge the dollar’s direction?
The next critical data point is the Personal Consumption Expenditures (PCE) Price Index for February, released on March 28, 2026. As the Fed’s preferred inflation gauge, it will carry significant weight. Beyond that, the April and May employment and Consumer Price Index (CPI) reports will be crucial for the Fed’s June policy decision.
Q6: How did other major currencies like the euro and yen react to this move?
The euro (EUR/USD) fell to a session low of 1.0720 during the dollar’s peak but recovered to 1.0785. The Japanese yen (USD/JPY) weakened past 152.55, a key intervention level, before strengthening back to 151.80. Both currencies demonstrated the global ripple effects of DXY volatility.
This article was produced with AI assistance and reviewed by our editorial team for accuracy and quality.