NEW YORK — March 11, 2026: The MicroSectors US Big Oil -3X Inverse Leveraged ETN (NRGD) entered technically oversold territory during Wednesday’s trading session, a move signaling intense selling pressure may be nearing exhaustion. The exchange-traded note, which provides leveraged inverse exposure to major U.S. oil companies, traded as low as $34.465 per share, brushing against its 52-week low. Consequently, its 14-day Relative Strength Index (RSI) plummeted to 26.9, a level analysts consider deeply oversold and a potential inflection point for contrarian buyers. This development arrives amid a mixed session for the broader S&P 500, which registered an RSI of 41.7, highlighting the specific and severe pressure on this volatile energy sector instrument.
NRGD Crowded With Sellers: A Technical Breakdown
The Relative Strength Index (RSI) reading of 26.9 for NRGD provides a clear, quantitative signal of the selling frenzy. Market technicians, including those at BNK Invest who first flagged the data, define oversold territory as an RSI below 30. This momentum oscillator measures the speed and change of price movements on a scale from 0 to 100. “An RSI dipping this far below 30 often indicates a washout,” explains Michael Chen, a Chartered Market Technician (CMT) at the Market Technicians Association. “It suggests the aggressive, emotional selling is potentially overdone and the asset may be due for a near-term technical bounce, though fundamental drivers remain paramount.” The day’s 8.7% drop for NRGD stands in stark contrast to the relative stability of the broader market, underscoring the unique risks and mechanics of leveraged inverse products.
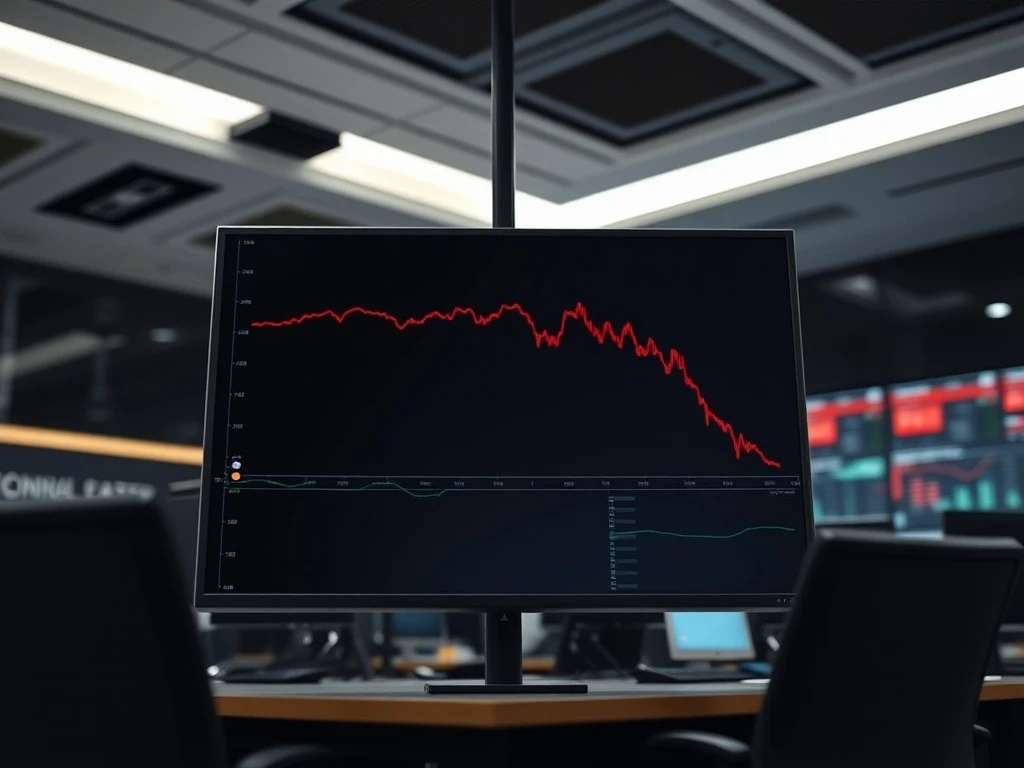
Examining the one-year performance chart reveals the extreme volatility inherent to NRGD. Its 52-week range stretches from a low of $34 per share to a high of $233.65. The last recorded trade at $34.01 places it perilously close to that annual floor. This dramatic range illustrates the amplified gains and losses these products can deliver, especially when tracking a sector as geopolitically and economically sensitive as energy. The current price action represents a staggering decline of over 85% from its peak, a trajectory that has accelerated in recent weeks as oil prices have shown unexpected resilience despite broader economic headwinds.
The Ripple Effect: Impacts on Energy Traders and ETF Mechanics
The oversold condition in NRGD creates immediate implications for several market participants. Primarily, it presents a high-risk, high-reward scenario for tactical traders. However, the impacts extend beyond simple trade setups.
- Contrarian Opportunity: For bullish speculators, the extreme RSI is a classic signal to scout for an entry point, betting that the selling pressure has exhausted itself and a mean-reversion bounce is imminent. This strategy, however, carries significant risk in a leveraged product that can continue to decay due to volatility drag.
- Leveraged ETF Decay: The prolonged downtrend exacerbates the negative effects of daily resets inherent to leveraged and inverse ETFs. As NRGD declines, the -3x daily leverage requires the fund to adjust its derivatives exposure, which can lead to performance erosion over time compared to a simple -3x multiple of the underlying index’s return.
- Options Market Activity: Such extreme moves often trigger heightened activity in the options chain. Data from the Options Clearing Corporation (OCC) frequently shows spikes in put-call ratios and implied volatility for ETFs at technical extremes, as traders hedge positions or make directional bets on a reversal.
Expert Perspective: Navigating Leveraged ETF Pitfalls
Financial advisors and institutional analysts consistently warn about the perils of holding leveraged ETFs like NRGD for extended periods. “The RSI signal is a useful short-term tool, but it does not override the structural warnings for these products,” states Dr. Anya Sharma, Director of ETF Research at the Finra-regulated Center for Investor Education. “Our 2025 study on leveraged ETF performance showed that over 90% of buy-and-hold retail investors in volatile sector ETFs lost money over a 12-month horizon, primarily due to decay and mistiming.” Sharma emphasizes that these instruments are designed for sophisticated, short-term trading, not long-term investment. This authoritative perspective, grounded in regulatory data, provides crucial context for the oversold reading, reminding investors that technical signals operate within a product’s structural constraints.
Broader Context: Energy Markets and Inverse Product Flows
To understand NRGD’s move, one must look at the assets it inversely tracks. NRGD seeks daily investment results that correspond to -3x the daily performance of the Solactive MicroSectors U.S. Big Oil Index. This index includes giants like Exxon Mobil, Chevron, and ConocoPhillips. When these companies’ stocks rise, NRGD falls—and vice versa. Therefore, NRGD’s plunge into oversold territory indirectly reflects underlying strength or stability in big oil equities, a nuance often missed in headlines.
| Instrument | Current RSI (March 11, 2026) | 52-Week Performance Context |
|---|---|---|
| NRGD (Inverse -3x Oil) | 26.9 (Oversold) | -85% from high, near 52-week low |
| S&P 500 Index | 41.7 (Neutral) | Moderately bullish trend YTD |
| WTI Crude Oil Futures | Approx. 58 | Stable within a $55-$65 range |
The table illustrates the dislocation. While oil prices and the broad market are not in oversold conditions, the leveraged inverse product tracking oil equities is. This divergence can occur due to the compounding effect of daily leverage, futures roll costs for the ETF’s underlying holdings, and concentrated selling pressure from traders exiting losing positions. It serves as a real-time case study in the complex, sometimes counterintuitive behavior of derivative-based exchange products.
What Happens Next: Monitoring for Confirmation or Continuation
The immediate question is whether the oversold RSI marks a local bottom or merely a pause before further declines. Technical analysts will watch for confirming signals. A bounce above the $34 support level on increasing volume would lend credence to the reversal thesis. Conversely, a decisive break below $34 on a closing basis could trigger another wave of automated selling and invalidate the oversold bounce signal. Furthermore, traders will monitor the RSI for a cross back above the 30 threshold, which would formally exit oversold territory and could attract momentum-based buyers. The scheduled weekly inventory report from the U.S. Energy Information Administration (EIA) on March 12 will provide a fundamental catalyst that could override technical setups, moving the underlying oil complex and, by extension, NRGD.
Market Participant Reactions and Sentiment Shifts
Initial reactions from trading desks and financial forums indicate a split in sentiment. Some quantitative funds see the extreme RSI as a systematic buy signal for a brief, mean-reversion trade. Meanwhile, risk management teams at major brokerages have reportedly issued internal memos reminding advisors of the suitability requirements for recommending such complex products to retail clients, especially during periods of extreme volatility. This bifurcated response—between tactical trading and compliance caution—highlights the dual nature of modern markets where algorithmic signals and fiduciary duty operate simultaneously.
Conclusion
The plunge of the MicroSectors US Big Oil -3X Inverse Leveraged ETN (NRGD) into oversold territory with an RSI of 26.9 is a significant technical event that underscores the amplified risks of leveraged inverse products. While it presents a potential entry signal for contrarian traders, the move is deeply contextualized by the structural decay of the ETF itself and the relative stability of its underlying benchmark. Investors should interpret this oversold condition not in isolation, but as a symptom of the intense volatility and sophisticated mechanics that define this corner of the market. The coming sessions will test whether this is a true exhaustion point or merely a waystation in a longer downtrend, with key support at $34 serving as the critical line in the sand.
Frequently Asked Questions
Q1: What does it mean that NRGD is oversold?
An oversold condition, typically indicated by a Relative Strength Index (RSI) below 30, suggests the asset has been subjected to aggressive selling pressure that may be overdone in the short term. For NRGD, an RSI of 26.9 signals a potential exhaustion point where sellers may be running out of steam, often watched for a possible technical bounce.
Q2: Is an oversold RSI a guaranteed buy signal for NRGD?
No, it is not a guarantee. While an oversold RSI can indicate a higher probability of a near-term price rebound, leveraged and inverse ETFs like NRGD have unique risks like volatility decay. The signal should be considered alongside the fund’s structure, underlying asset trends, and overall market conditions.
Q3: What is the key price level to watch for NRGD now?
The critical level is the 52-week low of $34 per share. Holding above this support would strengthen the case for an oversold bounce. A confirmed break and close below $34 could indicate the selling pressure is continuing and may lead to further declines.
Q4: How does NRGD’s performance relate to actual oil prices?
NRGD does not track oil prices directly. It seeks -3x the daily return of an index of major U.S. oil company stocks (like Exxon and Chevron). Therefore, its performance is inversely related to the share prices of those companies, which are influenced by, but not identical to, crude oil futures prices.
Q5: Why is the RSI for NRGD so much lower than for the S&P 500?
The disparity (26.9 vs. 41.7) highlights sector-specific and product-specific selling. NRGD is a niche, leveraged product experiencing concentrated outflows and price decay, while the S&P 500 represents the broad market, which is in a more neutral state. Leverage amplifies both gains and losses, leading to more extreme RSI readings.
Q6: Who should consider trading an ETF like NRGD?
NRGD is suitable only for sophisticated, active traders who understand leveraged and inverse products, closely monitor positions daily, and can tolerate high levels of risk and volatility. It is generally not appropriate for long-term investors or those with a low risk tolerance.