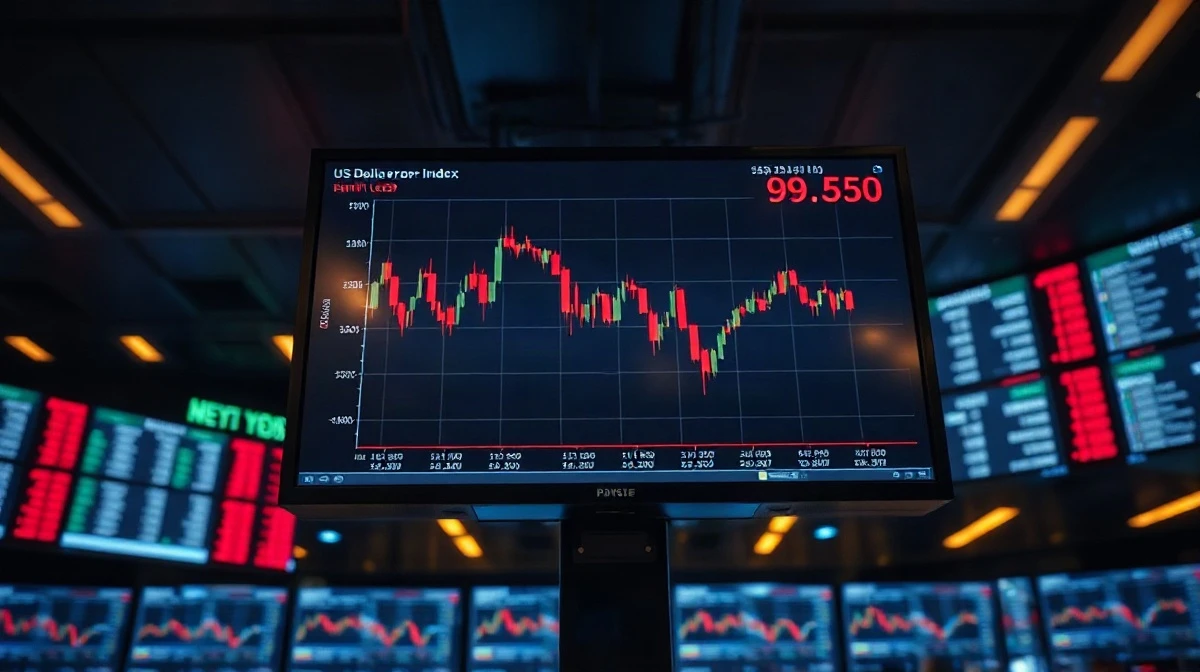
The US Dollar Index opened the North American session on Monday, August 17, 2026, directly on its 200-day Exponential Moving Average and failed there within the first minutes of trading, sending the gauge of the greenback against six major currencies to a session low just above 99.25. That move took out the August range, with the index now trading near 99.50, roughly a tenth of a percent lower on the day.
The rejection at the 200-day EMA — a level that has acted as resistance since late June — underscores the structural weakness in the dollar that has defined the third quarter. Each attempt to reclaim the long-term trend indicator has been met with fresh selling pressure, a pattern that technical analysts read as a clear sign that the path of least resistance remains to the downside.
Also read: Yen Weakens as Weak GDP Data and Rising JGB Yields Cloud BOJ Policy Outlook – BNY
Washington’s Fiscal Overhang Keeps the Dollar on the Defensive
The dollar’s inability to sustain rallies is increasingly tied to what traders describe as an ongoing fiscal overhang from Washington. The Treasury’s borrowing requirements remain elevated, and the yield curve has steepened as investors demand a higher term premium on longer-dated US debt. That dynamic, while supportive of yields at the long end, has not translated into dollar strength — a divergence that market participants attribute to concerns about the sustainability of the US fiscal trajectory.
These concerns are not new. The Congressional Budget Office’s mid-year projections, released in June, showed the federal deficit on track to exceed 7% of GDP for the third consecutive year, a level not sustained since the aftermath of the 2008 financial crisis. But the market’s tolerance for that reality appears to be thinning. Foreign official holders of US Treasuries have been net sellers in four of the past five months, according to Treasury International Capital data through June, and the dollar has absorbed the impact.
Also read: Yen Retreats Below 159.00 as Japan's GDP Miss Clouds BOJ Rate Path
The breakdown of the traditional correlation between yields and the dollar is the most telling development. In a typical cycle, rising US yields attract capital inflows and support the currency. That relationship has broken down since the spring, when the Federal Reserve signaled that its easing cycle was far from over even as inflation data showed signs of stickiness at the core level.
Fed Policy and the Path Forward
The Federal Reserve’s policy trajectory remains the dominant driver for the Dollar Index. The central bank delivered its third rate cut of the year at the July meeting, bringing the federal funds rate to a range of 3.50% to 3.75%, and market pricing currently implies a better-than-even chance of another quarter-point reduction at the September meeting. The Fed’s own projections, updated in June, show two additional cuts by year-end, a view that Chair Janet Yellen’s successor has done little to push back against in subsequent public remarks.
That dovish posture stands in contrast to other major central banks. The European Central Bank has held its deposit rate at 2.25% since March, and the Bank of Japan has signaled that it may begin normalizing policy from its ultra-low levels as early as October. The resulting interest rate differentials have narrowed, removing a key pillar of dollar support that existed throughout the 2022–2024 period.
For traders, the immediate question is whether the 99.00 level — a psychologically significant round number that coincides with the 61.8% Fibonacci retracement of the 2021–2025 advance — will hold. A daily close below that level would open the door to a test of the 98.30 region, the low from October 2025. On the upside, the dollar needs to reclaim the 200-day EMA, now converging with the 100.00 handle, to signal that the corrective phase has run its course.
The August range breakdown also carries implications beyond the currency market. A weaker dollar typically provides a tailwind for commodities priced in the currency, including gold, which is trading near its all-time high above $3,200 per ounce, and for emerging market assets, which benefit from improved external financing conditions. Conversely, multinational corporations with significant overseas earnings stand to see a modest boost to translated revenues in the coming earnings season.
The immediate catalyst to watch is the release of the Federal Open Market Committee minutes on Wednesday, which will offer investors a fuller picture of the internal debate at the July meeting. Any signal that the committee is split on the pace of easing could provide the dollar with a short-term reprieve, though the broader fiscal and policy trends suggest that any bounce would likely be sold.
This article is for informational purposes only and does not constitute financial advice. The foreign exchange market is highly volatile and involves substantial risk. Past performance is not indicative of future results.